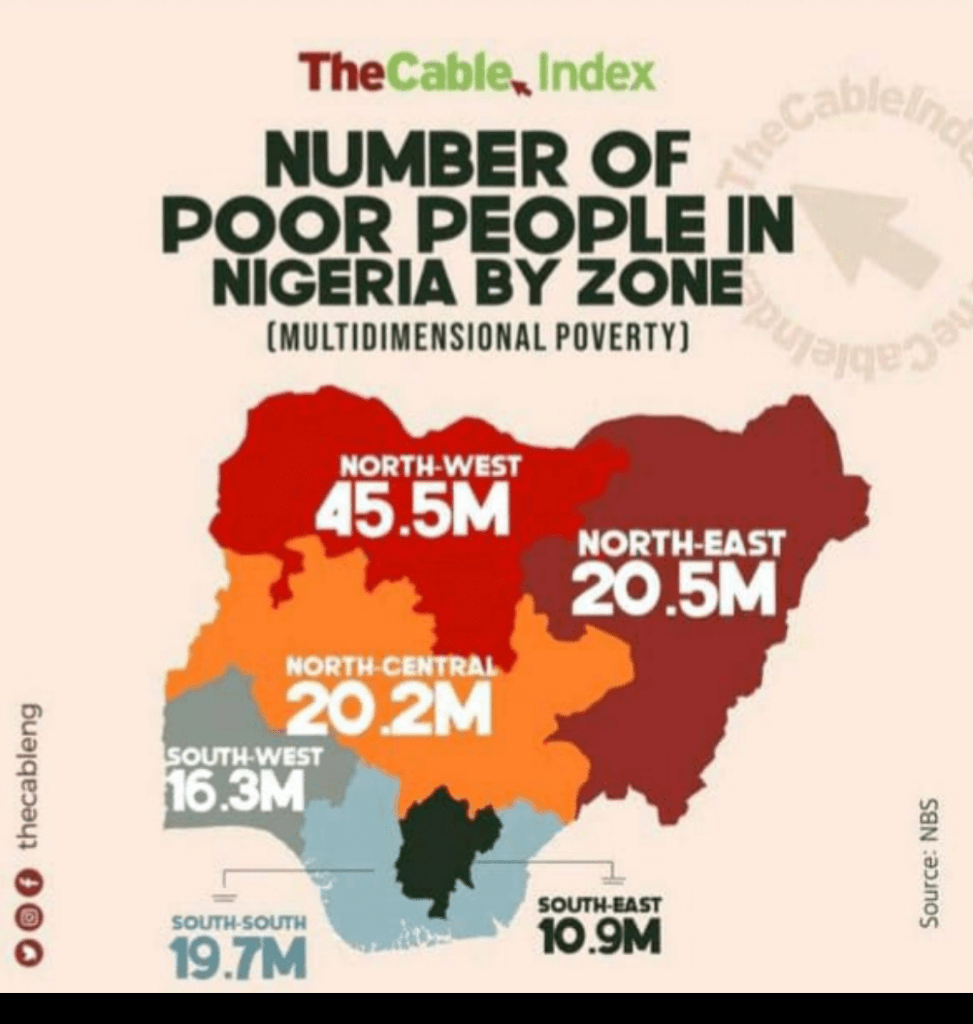
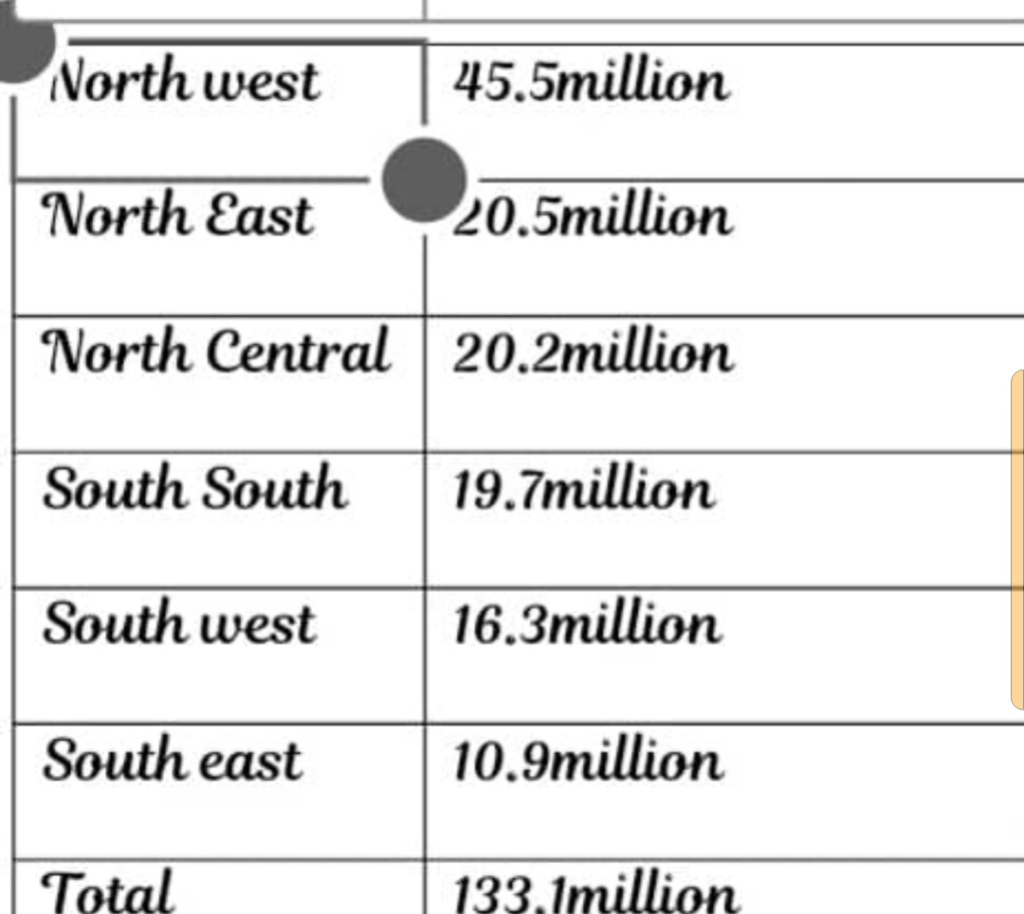
2 second region is the north east with the number of 20.5m, which they are located at the upper region of the map.
3 The third region is the north central with the number of 20.2m which the are located at the middle region of the map.
4 The fourth region is the south south with the total number of 19.7m, and this region are located at the edge of the national map.
5 The five data been interpreted is the south east with the number of 16.3m, which they are located close to the south south region at the edge of the national map
6 the last region is 10.9m which the are located at the edge.
In conclusion in Nigeria the rate of people who are poor are more than the rate of people that are rich.

Leave a comment